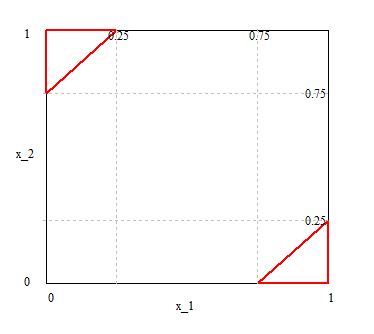
.As Melody often notes, it can be useful to plot these sort of probabilities against each other. Consider x_1 and x_2:

The probabilities of the pair can be thought of as uniformly randomly scattered points within a unit square.
The only regions of the square in which the lengths between the two values are greater than 3/4, are within the two red triangles indicated in the image above.
The probability that the lengths are greater than 3/4 is therefore given by p = Area of triangles/Area of square
The same probability holds for the lengths between x_3 and x_4, so, because the two probabilities are independent, the overall probability is given by p^2.
I'll leave you to do the number crunching.