Helperid bought my attention back to this question.
He has not even read my response to him, from a couple of days ago, but I am curious myself.
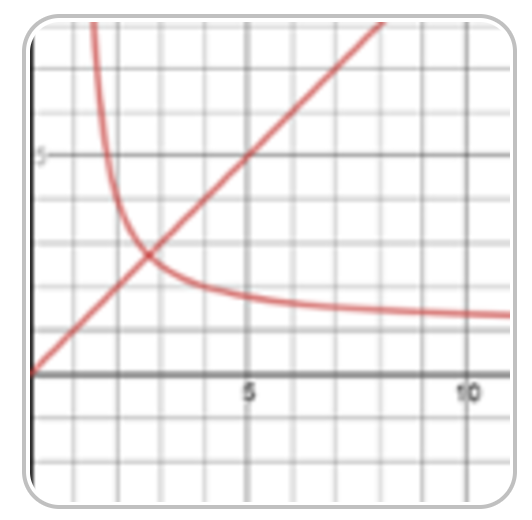
How can I get a graph to look like that curved graph in his profile pic?
(I hope this is not a doh moment - but too bad if it is)
I think it goes through the points (2.75,2.75) (1.75,5) and (5,1.75)
I assumed it was half a hyperbola and got to xy=1.75*5=8.75 but that does not go through (2.75,2.75)
So it is not correct. 
Can someone offer a better attack method and answer?


 +118735